 on August 26, 2026
Rental Property Maintenance Software
on August 26, 2026
Rental Property Maintenance Software A predictive maintenance strategy for a rental portfolio uses work order history, asset age, repeat-call patterns, and vendor completion data to forecast which assets will need attention next, then schedules that work before residents report a failure. It differs from the industrial version of predictive maintenance in one important way. Residential portfolios forecast from operational records. Industrial systems rely on sensors attached to equipment. The inputs are different; the discipline is the same.
Most predictive maintenance advice written for property managers was borrowed from manufacturing, where the assumptions do not hold. This guide outlines how to build a program using the data your portfolio already produces.
The Numbers Everyone Quotes Come From Factories
Almost every article on predictive maintenance cites the same set of figures. They originate with the U.S. Department of Energy’s Operations & Maintenance Best Practices Guide, which reports that a functioning predictive maintenance program delivers industrial average results of:
- 25% to 30% reduction in maintenance costs
- 70% to 75% elimination of breakdowns
- 35% to 45% reduction in downtime
- 20% to 25% increase in production
The same guide estimates predictive maintenance saves 8% to 12% over preventive maintenance alone, and that facilities heavily reliant on reactive work can see savings above 30% to 40%.
Those are real numbers from real programs. They also come from industrial plants monitoring high-value rotating equipment, and one of them (“increase in production”) has no residential equivalent at all. A property manager reading that list has no way to know which parts apply to a portfolio of scattered single-family homes.
The DOE guide is also candid about the cost of entry. It states plainly that starting a predictive maintenance program “is not inexpensive,” requiring diagnostic equipment, staff training, and considerable funding. That caveat is the part property management content tends to leave out, and it is the part that matters most.
Why Condition Monitoring Does Not Transfer To Residential
Industrial predictive maintenance is condition-based. The DOE guide draws the distinction cleanly: predictive maintenance schedules work “based on the quantified condition of the equipment,” while preventive maintenance schedules work “solely based on time.” Quantifying condition requires instrumentation, which means a sensor on the asset.
That works when the asset justifies it. Entry-level wireless vibration sensors list at around $400 each, before gateways, installation, or software, and prices climb past $3,000 for higher-sensitivity units. On a large industrial compressor, that is a rounding error against the cost of unplanned failure. On a dishwasher that costs $540 to $2,175 installed to replace, a single sensor approaches the price of the appliance it is watching.
Scattered portfolios make it worse. The assets are low-value, there are several per unit, and the units sit across dozens of zip codes. Industrial equipment is typically located on one plant floor. This is the honest reason most residential predictive maintenance programs stall. Teams price the hardware and stop. The industrial playbook is not feasible for residential assets.
The Four Data Sources You Already Have
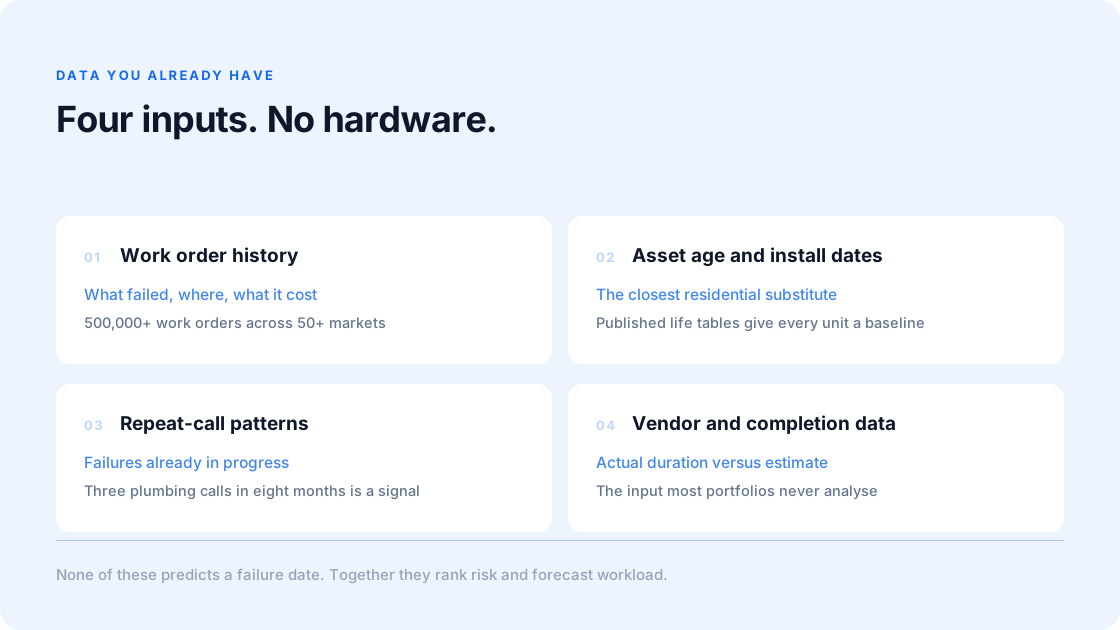
Residential portfolios do generate predictive signal. It arrives as operational records. This data costs nothing extra to collect because the work is already being done.
- Work order history: Every completed job records what failed, in which unit, what it cost, and how long it took. Volume makes this useful. Patterns are invisible across 40 doors. These same patterns become obvious across 4,000. LuMi, Lula’s maintenance intelligence layer, is trained on seven years of this data, covering more than 500,000 work orders across over 50 markets.
- Asset age and install dates: This is the closest residential substitute for a condition sensor, and it is badly underused. Published life expectancy tables give a defensible baseline for every major component in a unit. A furnace installed in 2011 sits inside the 15 to 25 year band. A water heater installed in 2016 is already past the low end of its 6 to 12 year range. Age alone will not tell you which unit fails next month. It reliably identifies which third of the portfolio carries the most risk this year.
- Repeat-call patterns: A unit generating three plumbing calls in eight months is signaling something a single work order never shows. Repeat calls against the same unit and the same category are among the strongest predictors available in residential. They capture the failures that are actively in progress. Statistical averages only capture what is due.
- Vendor and completion data: How long jobs actually take, how often a job needs a second visit, and which categories consistently run past their estimate. This feeds forecasting accuracy directly, and it is the input most portfolios never analyze.
Ranking Portfolio Risk Without A Single Sensor
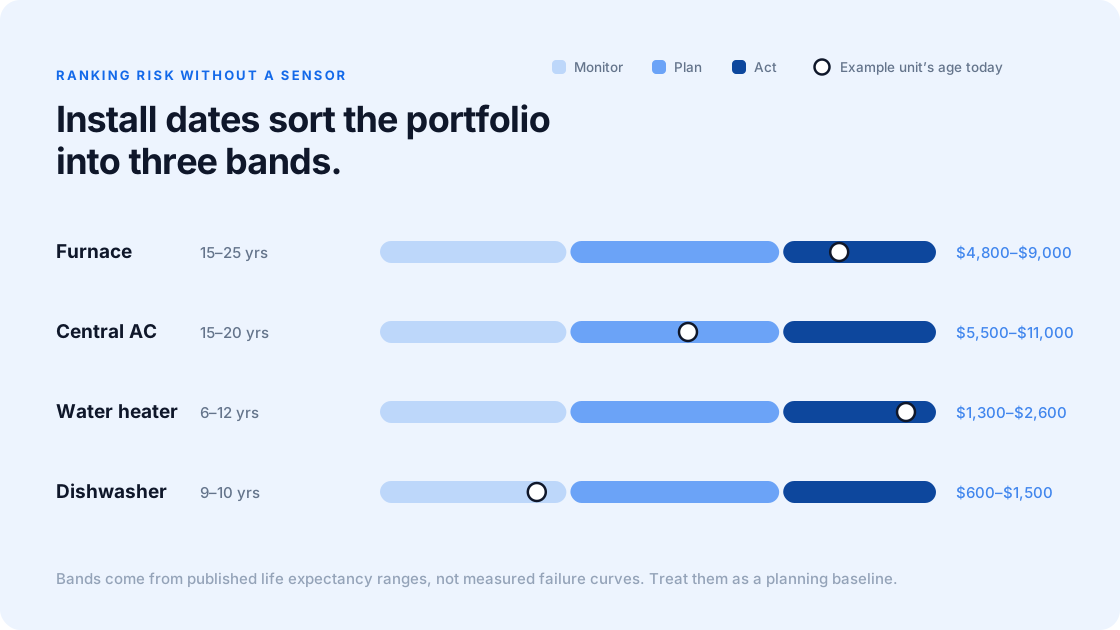
Asset age is the input most portfolios already hold and rarely use, so it is worth showing exactly how far it goes on its own.
The table below pairs published life expectancy figures with 2026 replacement cost ranges for the assets that generate most residential maintenance spend.
|
Asset |
Expected life (years) |
Typical replacement cost, installed |
|---|---|---|
| Furnace | 15 to 25 | $2,800 to $12,000 (avg ~$5,000) |
| Central air conditioner | 7 to 15 | $3,000 to $7,500 |
| Heat pump | 10 to 15 | $4,000 to $8,000 |
| Water heater (tank) | 6 to 12 | $881 to $1,825 (avg $1,346) |
| Refrigerator | 9 to 13 | $675 to $2,500 |
| Dishwasher | 9 | $540 to $2,175 |
| Range or oven | 13 to 15 | $700 to $1,600 |
| Clothes dryer | 13 | $600 to $1,500 |
| Garbage disposal | 12 | $250 to $950 |
Life expectancy from InterNACHI. Replacement costs compiled from 2026 cost guides by Angi, HomeGuide, ConsumerAffairs, and Sears Home Services. Ranges are national averages and vary by market, unit size, and efficiency tier.
Those two columns are enough to build a simple risk band, applied against the install dates already in your property records:
- Monitor: Asset is below the low end of its expected life. No action beyond routine preventive service.
- Plan: Asset is inside its expected life range. Budget for replacement and stop approving major repairs without a repair-versus-replace check.
- Act: Asset is past the high end of its expected life. Move it into the capital plan and schedule proactive inspection.
Applied across a portfolio, this sorts every unit into three groups using data already sitting in the property records. It will not tell you which water heater fails in October. It reliably tells you which quarter of your portfolio is carrying the replacement risk, which is the question capital planning actually needs answered.
Bands are derived from the published life expectancy ranges. They are not measured failure curves. Treat them as a planning baseline. Portfolio-specific history should refine them over time.
What Each Source Can And Cannot Predict
Being specific about the limits is what separates a working program from a dashboard nobody trusts.
|
Data source |
Predicts well |
Does not predict |
|---|---|---|
| Work order history | Category volume, seasonal load, cost ranges | Which individual unit fails next |
| Asset age and install dates | Portfolio-level replacement risk, capital planning windows | Timing for any single asset |
| Repeat-call patterns | Units with active, unresolved underlying problems | First-time failures in stable units |
| Vendor and completion data | Job duration, capacity requirements, second-visit risk | Asset condition |
Read the right-hand column carefully. None of these inputs predicts an individual failure date. A sensor on an industrial motor provides that specific information. A residential predictive program forecasts risk distribution and workload. Specific failure events are difficult to predict. Programs that promise more than that lose credibility with operations teams the first time a predicted failure does not happen.
Before You Start: A Readiness Check
Forecasting quality is capped by intake quality. Run through these four before investing in any predictive capability, because a model built on inconsistent records will produce confident, wrong answers.
- Consistent intake: Every request enters through one channel and creates one trackable record. Requests arriving by text, voicemail, and hallway conversation cannot be analyzed.
- Categorized work orders: Jobs are tagged by system (plumbing, HVAC, electrical, appliance) using a fixed taxonomy. Free-text descriptions alone are not enough.
- Asset records: Install dates and model information captured at the unit level. This is the single most common gap, and it is the one that unlocks age-based forecasting.
- Completion data: Final cost, actual duration, and resolution captured when the job closes. Without it, the system has nothing to learn from.
Portfolios missing two or more of these should fix intake first. That work is not glamorous, and it produces more forecasting value than any model selection decision.
A Phased Sequence That Works
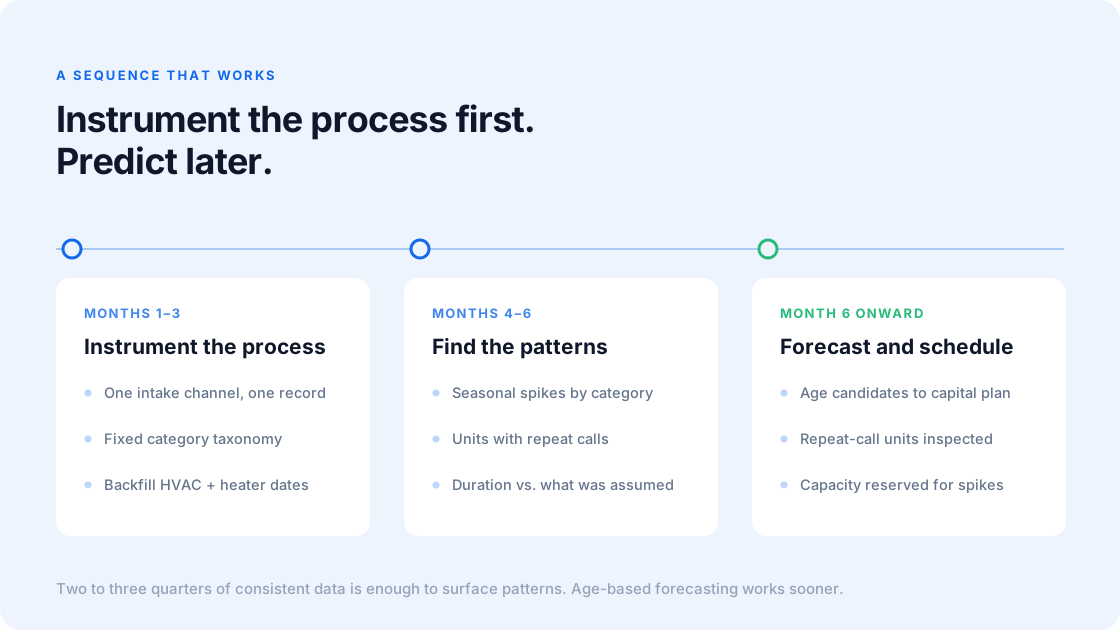
Months 1 To 3: Instrument The Process, Not The Equipment
Standardize intake, lock the category taxonomy, and start capturing completion data on every job. Backfill asset install dates for the highest-cost systems (HVAC and water heaters) first. The goal for this phase is to establish clean records. Accurate predictions follow later.
Months 4 To 6: Find The Patterns
With two to three quarters of consistent data, run the analysis that needs volume. Which categories spike seasonally. Which units generate repeat calls. Where actual job duration diverges from what was assumed. Use deferred maintenance backlog tracking to see which work is quietly slipping. This phase produces a risk-ranked view of the portfolio.
Month 6 Onward: Forecast And Schedule Against It
Convert the risk ranking into planned work. Age-based replacement candidates go into capital planning. Repeat-call units get proactive inspections. Seasonal spikes get capacity reserved ahead of them. These spikes should not be absorbed as emergencies.
That last step is where programs most often fail, and it deserves its own section.
Where Predictive Programs Break Down
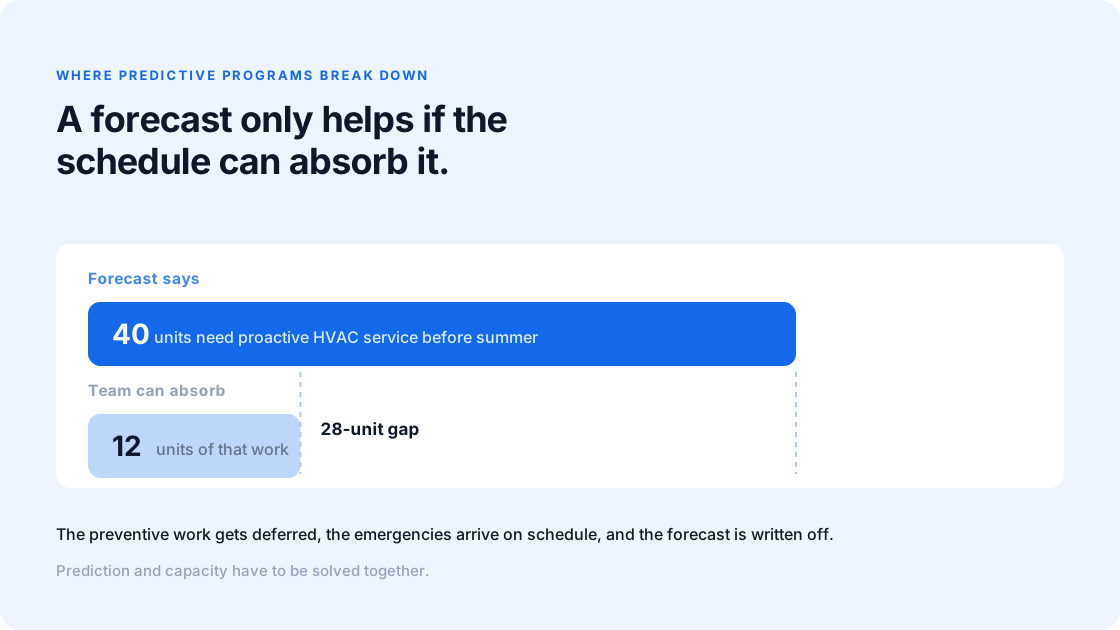
A forecast produces a plan. A plan only helps if the schedule can absorb it.
This is the failure mode that kills otherwise sound predictive programs. The analysis correctly identifies 40 units needing proactive HVAC service before summer, and the team has capacity for 12. The preventive work gets deferred, the emergencies arrive on schedule, and the forecast is quietly written off as theoretical.
Prediction and capacity have to be solved together. Forecasted demand needs to be matched against what technicians can genuinely absorb, which is a different problem from route efficiency and is covered in detail in how Foresight balances technician workload.
For teams weighing the cost side of this, predictive maintenance pricing covers how the spend model changes when work shifts from emergency to planned.
What To Measure
Four metrics tell you whether the program is working. Track them from the start so you have a baseline to compare against.
- Reactive share of total work orders: The headline metric. DOE reports that average facilities still run more than 55% reactive, while consistently top-performing programs run under 10%. Residential portfolios will not reach industrial benchmarks, and the direction of travel is what matters.
- Repeat visit rate: The percentage of jobs requiring a second trip. Falling repeat visits indicate that diagnosis and parts planning are improving.
- Preventive completion rate: The percentage of scheduled preventive work actually completed on time. This is the number that exposes the capacity problem above.
- Emergency cost premium: What emergency work costs relative to the same job scheduled in advance. This is what makes the business case to owners.
See It In Foresight
Foresight applies this approach across Lula’s network of more than 9,000 vetted pros serving over 350,000 properties in 50-plus markets, with LuMi handling triage, cost prediction, and capacity-aware scheduling in one workflow. Book a walkthrough to see how the forecast connects to the schedule.
Predictive Maintenance Strategy FAQ’s
Do I need IoT sensors to run predictive maintenance on rental properties?
No. For residential portfolios the monitoring hardware costs more than the assets it would watch, so age and work order history do the forecasting instead. Sensors are worth considering only on shared multifamily equipment such as boilers, central chillers, and elevators, where one asset serves many doors and the value justifies the instrumentation.
How much historical work order data do I need before forecasting is useful?
Roughly two to three quarters of consistently categorized data is enough to surface seasonal patterns and repeat-call units. Age-based replacement forecasting works sooner, because it depends on install dates rather than accumulated history. Portfolios under about 200 doors will find category-level patterns more reliable than unit-level ones, since smaller samples produce noisier signals.
Who owns the predictive maintenance program inside a property management company?
In practice it works best when a maintenance coordinator or operations lead owns the data hygiene and a regional or portfolio manager owns the capital planning decisions the forecast feeds. Splitting it further tends to stall the program, because the person who sees the pattern needs enough authority to reserve capacity against it.
Does predictive maintenance reduce headcount?
Usually no, and that is rarely the goal. It recovers capacity lost to emergency reroutes and second visits, which typically means the existing team clears more work without overtime. Whether headcount changes depends on portfolio growth.
Anything found written in this article was written solely for informational purposes. We advise that you receive professional advice if you plan to move forward with any of the information found. You agree that neither Lula or the author are liable for any damages that arise from the use of the information found within this article
